


Thoughts on stock market
- Jul 12, 2017
- 4 min read
My currently belief is that stock price is mainly event-driving, which means quantitative method is just a tool we use to describe and analysis those events. So in my own view, our starting point should not be quantitative analysis on the stock price itself, instead, we should start to think about those events happening in the market and how they influence the stock prices. To describe the cause and effect of market events, then the quantitative analysis comes in.
Base on the idea mentioned in the first paragraph, I do not believe, for example, a daily return of a single stock today has high correlation with the return of the same stock tomorrow. Because the direction of the market can change rapidly just because an extreme event happened, and such a event may not be predictable at all.
So I think a new way of understanding the stock market is needed. I was trying to get some insight in the stock price, so I tried to visualize the correlation table of a stock market, I picked 7 high-tech stocks and draw the correlation table below. The table obviously shows that some of those stock has a high correlation with each other, in other words, they tend to move together in the same direction.

Then I drew another table with more stocks involved, things became a little messy, it seems that I can not get any meaningful information through this picture. So I think I need a better way to visualize those relations between these stocks.

It occurs to me that maybe the relationship between these stocks can be represented by using a visual network, where the nodes in the network represent the stocks and the relationships can be represented by using edges between them, also we can put more or less weight on specific edges to denote stronger or weaker relationships between two stocks.
I gather all the daily stock prices for the first half of 2017 from S&P 500, and assume that if two stocks have a correlation whose absolute value is higher than 0.6, then there is a connection between them. Then I draw the 3D network and the result is very intuitive. The size of the node proportional to its degree, which means the more edges or more connection the node has, it tend to be bigger in size. Here we use a graph drawing optimization algorithms called: Force-directed graph drawing(wiki link). And the method I used to paint the color and draw the clustering of node is a community detection algorithm based on Modularity. Modularity is one measure of the structure of networks or graphs. It was designed to measure the strength of division of a network into modules (also called groups, clusters or communities).(wiki link)
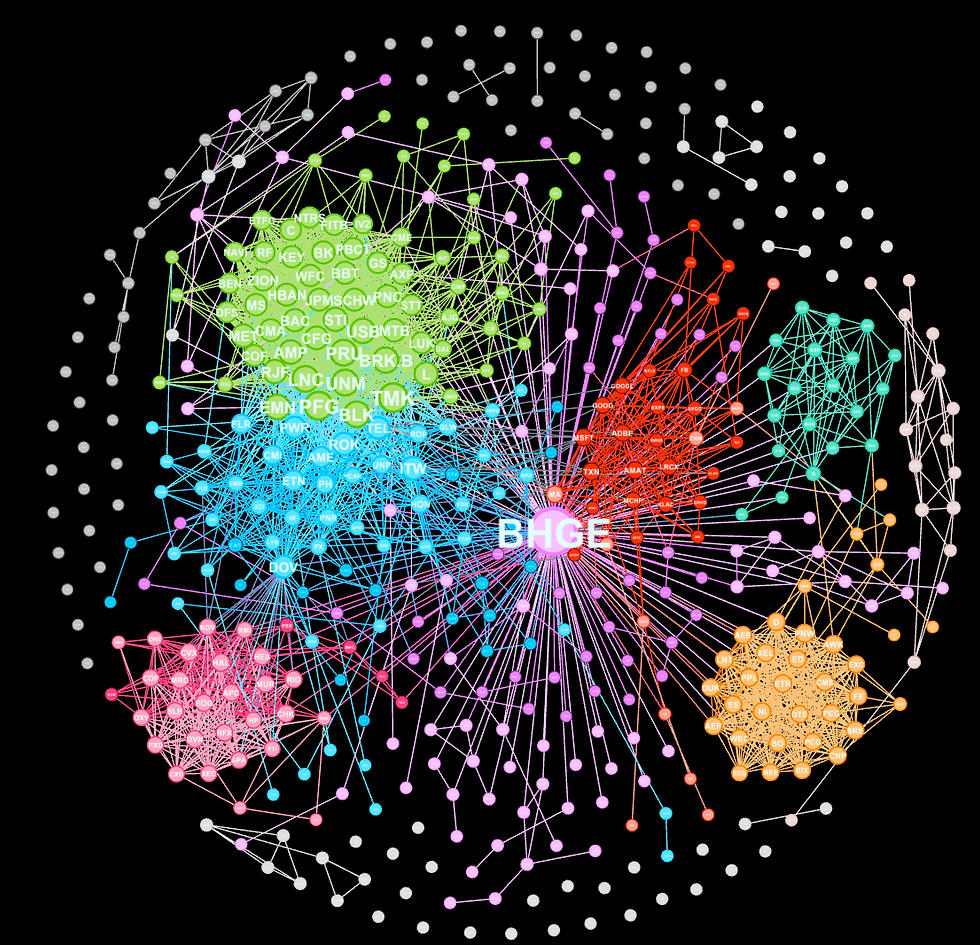
We can see the center of the graph is a company name: BHGE. (Baker Hughes, a GE Company is an American industrial service company, it is one of the world's largest oil field services companies.) It make sense, right? the largest oil and energy companies usually perform a important role in the economy in the US, since the nature resources it provides like Petroleum is vital to many industries, and also Oil accounts for a large percentage of the world’s energy consumption, it should has broad connection to other companies in all fields.
Then we can take a closer look at several parts in the graph, the green cluster also represents an important part in the economy. We can see a list of companies in this cluster: C(Citigroup Inc), JPM(JPMorgan Chase & Co), GS(Goldman Sachs Group Inc), BRK.B(Berkshire Hathaway Inc), BAC(Bank of America Corp). These are financial service group. They have massive connections to other parts of the network, because those financial intermediaries has a very important role in economy and engage in almost every big event where there are cash flows behind it.

Their stock prices are highly correlated, they also have intensive connection and relation with each other. We can see the companies which have direction connection with the city group from the graph below.

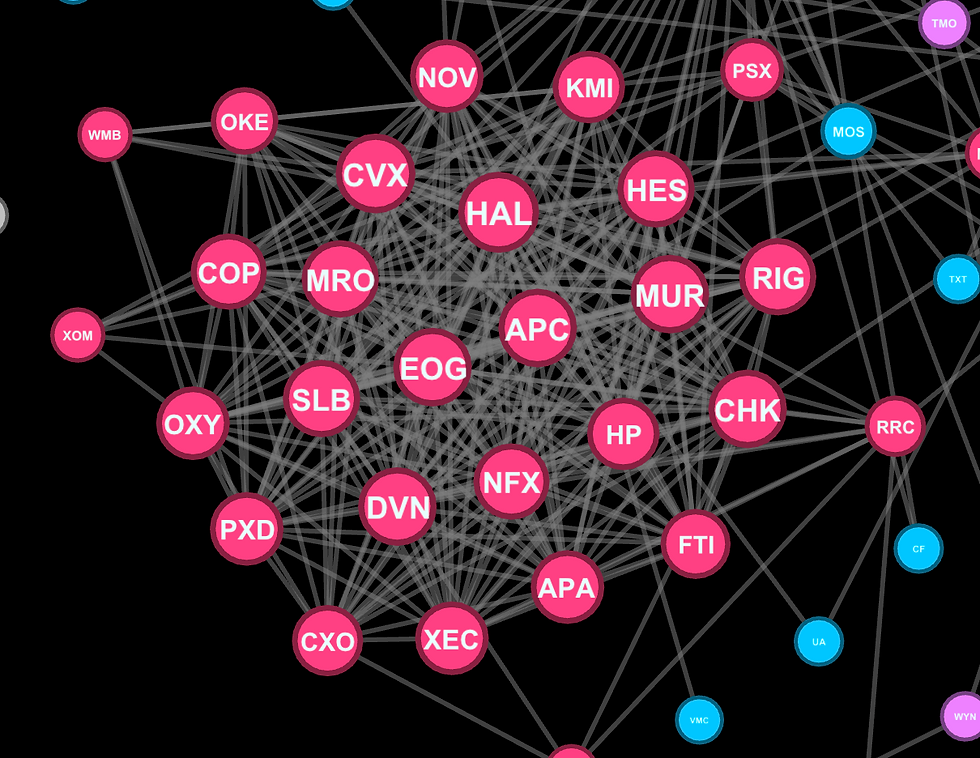
We can also see other interesting clusters in the graph, such as oil and gas cluster, which includes companies: EOG(EOG Resources Inc), APC(Anadarko Petroleum Corporation), MUR(Murphy Oil Corporation) and so on.
And high-tech and electronic manufacturer cluster which includes: GOOG(Alphabet Inc), FB(Facebook, Inc), APPL(Apple Inc), ADBE(Adobe Systems Incorporated), AMAT(Applied Materials, Inc).

There are some companies which owns connection with several clusters. I thinks those companies can have a influence on the price of stock. Analyzing these companies also intrigues some interesting ideas about the stock market which I will mention at the end of this blog. The blue dot(DOV) in the center of the following graph is an example of this kind of dots.

The company's name is DOV (Dover Corp) which has strong connection with several clustering including energy cluster, oil and gas cluster and financial intermediaries cluster. In other words there is a high chance that companies like this perform as a bridge between different industry, the turmoil of the stock prices in one cluster is likely to transmit to other clusters through these bridges.
There are a lot of other interesting features in the network and I think I will constantly go back to this graph and discuss more about it.
From those exploration today, there are two vague ideas come to my mind. First, in a certain clustering, for example, we know that stock price have high correlation with each other, some prices of stocks may lead other stock prices to go up and down, due to different sensitivities of those stocks, there might exist arbitrage to exploit. Second, price turmoil in one cluster can transmit through the network, so maybe we can introduce a evolutionary network model combined with some machine learning algorithm to find the pattern of how the news events influence the stock price, and how those turmoil transmit in the network, so we can describe the interaction between stock price and may develope more accurate prediction method. These might be the following work.
Comments